本指南描述怎样使用 Xdebug,Phpstorm 调试本地 PHP Web 应用。
前提
假设你已经安装了 PHP 运行环境,例如 Xampp 。
安装 Xdebug
- 从官方站点下载与你 PHP 兼容(关注 “PHP 版本号”和“线程安全/非线程安全”选项)的 Xdebug 扩展。
- 拷贝扩展文件到 Web 服务器相关位置
- 在 php.ini 文件下方追加以下内容
[Xdebug]
zend_extension=<full_path_to_xdebug_extension>
xdebug.remote_enable=1
xdebug.remote_host=<the host where PhpStorm is running (e.g. localhost)>
xdebug.remote_port=<the port to which Xdebug tries to connect on the host where PhpStorm is running (default 9000)>
- 重启 Web 服务
- 确认安装结果
phpinfo();
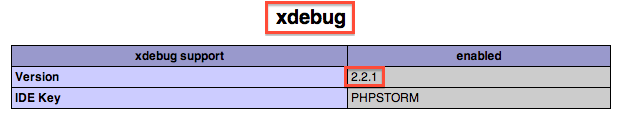
说明:
Xampp 本身已经包含了 Xdebug 扩展,位于 php\ext 内。
准备 Phpstorm
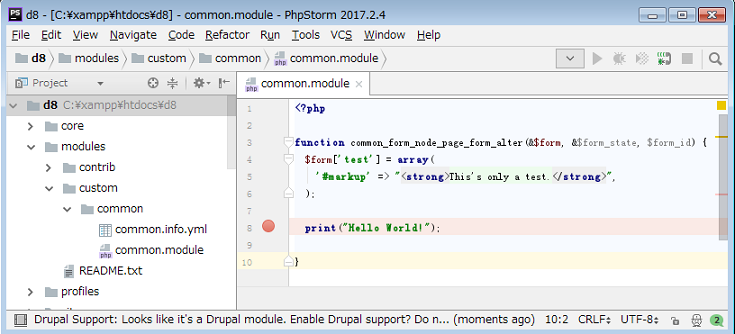
- 基于要调试的代码,在 Phpstorm 内创建工程
- 切换“Start Listening for PHP Debug Connections”按钮。


在源码内设置断点
激活服务器上的 Debugger
为了激活服务器端的 Debugger,需要设置一个特定的 GET/POST 或者 COOKIE 参数。可以手动做这件事,但更方便的是使用浏览器工具栏这样的工具。
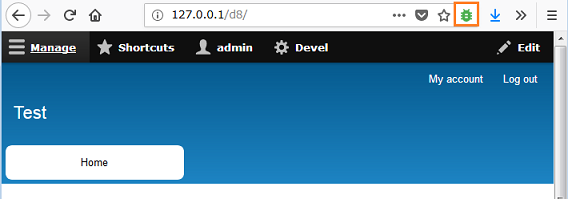
我们在 FireFox 浏览器安装 Xdebug Helper,之后你会看到以下图标。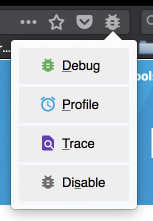
在浏览器启动调试会话
设置初始路径映射
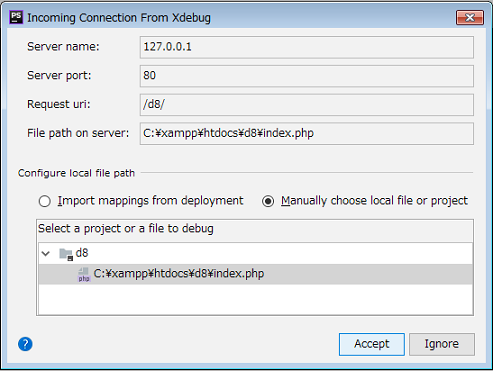
切换到 Phpstorm,你会看到“Incoming Connection From Xdebug”对话框。这里设置服务器文件路径和工程文件路径的对应关系,点击 Accept 即可。
说明:
有些情况你创建工程的代码可能不是正在运行的代码,例如只是正运行代码的拷贝。这种情况不会出现上述对话框,Phpstorm 监测不到。此时你需要去 Settings -> Languages & Frameworks -> PHP -> Servers 追加 Server 并进行文件路径映射。
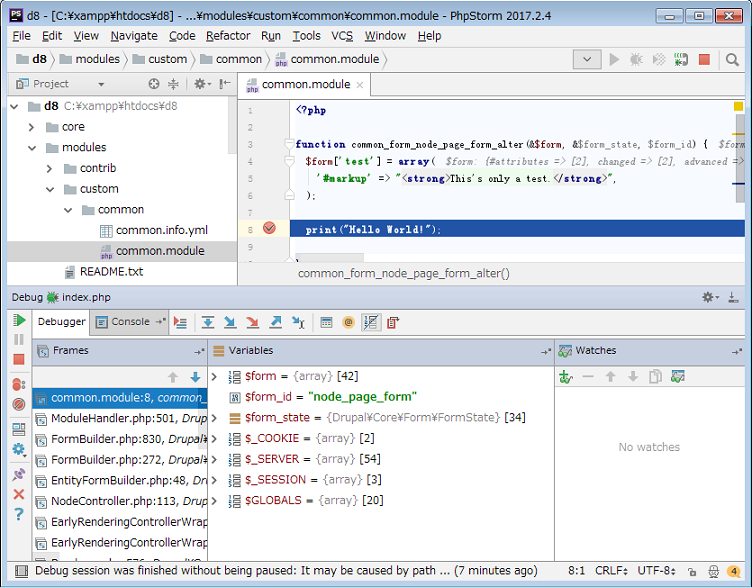
调试!